We need to consider the reciprocal relationship inherit in goal oriented progress when using percentages.
The Inverse
When I say reciprocal, i am describing a system that is inversely proportional.
The most simple being:
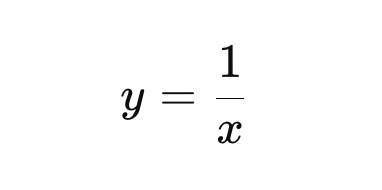
As y grows infinitely large, 1/x shrinks infinitely small.
Now lets try applying this to percentages.
Quantitative Percentages
Let’s consider something that can have a value of 100% In a normal percentages, every percent is exactly the same value.
Going from 0% to 1% is the same as going from 50% to 51%, which is the same as going from 99% to 100%.
They are all one hundredth of the total. This is what we were taught percentages are. It’s the definition.
- There is no unique individual percent.
- They are all interchangeable.
- The represent the same amount of progress.
This, however, is not the full story.
Chasing Perfection
There is a difference between the above 100%, which behaves like a quantity to be reached, and attempting to achieve an ideal state.
Benchmarks, such as test scores, are graded 100% when there are no mistakes.
This 100% is a goal, not a quantity.
It represents perfection or acheivement.
We intuitively apply the same logic as a quantitative percentage.
But in this case, it falls apart.
This 100% behaves much more like a limit, with logarithmic growth seen as you approach it.
Reciprocate
When chasing an ideal state, we need to instead look at the reciprocal relationship of the percentage.
We must think about it in inversely relative terms, in order to see the absolute behavior
To do this, lets instead think about what it would take to be twice as good as a low percentage, like 10%.
Intuitively, you may just want to double it to 20%, as that would be twice as much.
But remember, 100% is our goal.
To get twice as close to 100% from 10%, we need to go all the way to 55%.
This is the midpoint between where we are, and where we want to be.
Let’s do the same thing with 90%. How would we become twice as good?
We obviously wouldn’t double it, as we can’t go higher than 100%.
Once again, it is the midpoint that matters.
We see that going from 90% to 95% represents the same relative change as 10% to 55%.
We got twice as close to our goal both times.
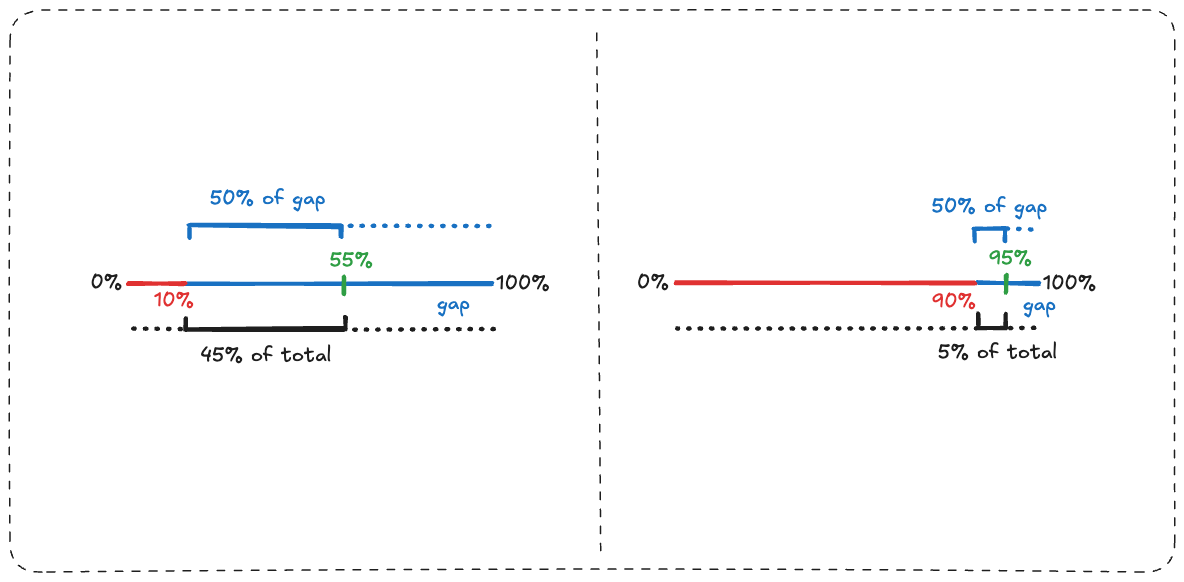
The 45% added to 10% is the same increase as the 5% added to 90%. They are both 50% of the remaining gap
The Gap to Perfection
This “Gap to perfection” can be represented as:
1 - x
where x is the current level of capability.
Example:
- Moving from 0% to 10% closes 10% of the gap
- Moving from 10% to 19% also closes 10% of the remaining gap - gap of 90%
- …
- Moving from 90% to 91% closes 10% of the remaining gap.
- Moving from 99% to 99.1% closes only 0.1% of the total gap but again closes 10% of the remaining gap
This sounds quite similar to Zenos Paradox
Exponential Decay
When you decrease a system by an amount that is also dependent on the system, it results in exponential decay.
It ends up in paradoxes like Zeno’s because it is a self-reference, as described in There’s Only One Paradox
To see why mathematically, lets describe our quantitative percentage which has no self reference and operates linearly:
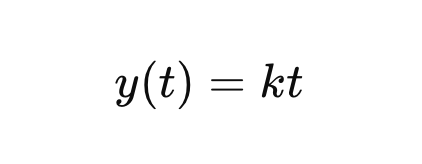
- y(t) is the percentage completed at time t,
- k is the rate of progress.
The differential of a linear function is just k, the constant, as it represents constant change.
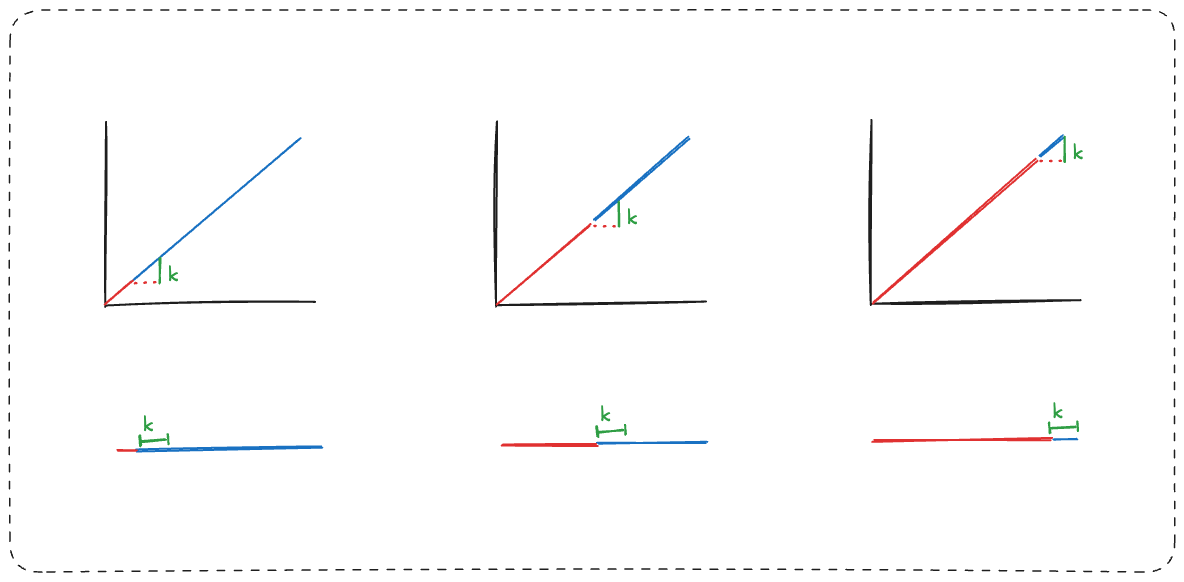
Now shift our perspective to closing the remaining gap by a constant fraction for each step t.
The amount you close at each step now depends on how much of the gap remains.
We need to think in terms of differentials.
- G(t) represent the remaining gap at time t (starting at G(0)=100%),
- k represents the fraction of the gap closed per step (example: k=0.1 for 10%).
At each step, the rate of progress is proportional to the remaining gap:
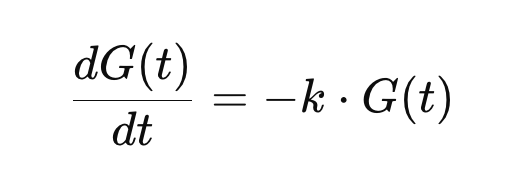
Solving this differential equation gives:
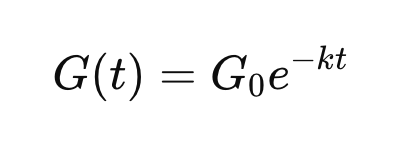
We can see that the change in G(t) is dependent on itself.
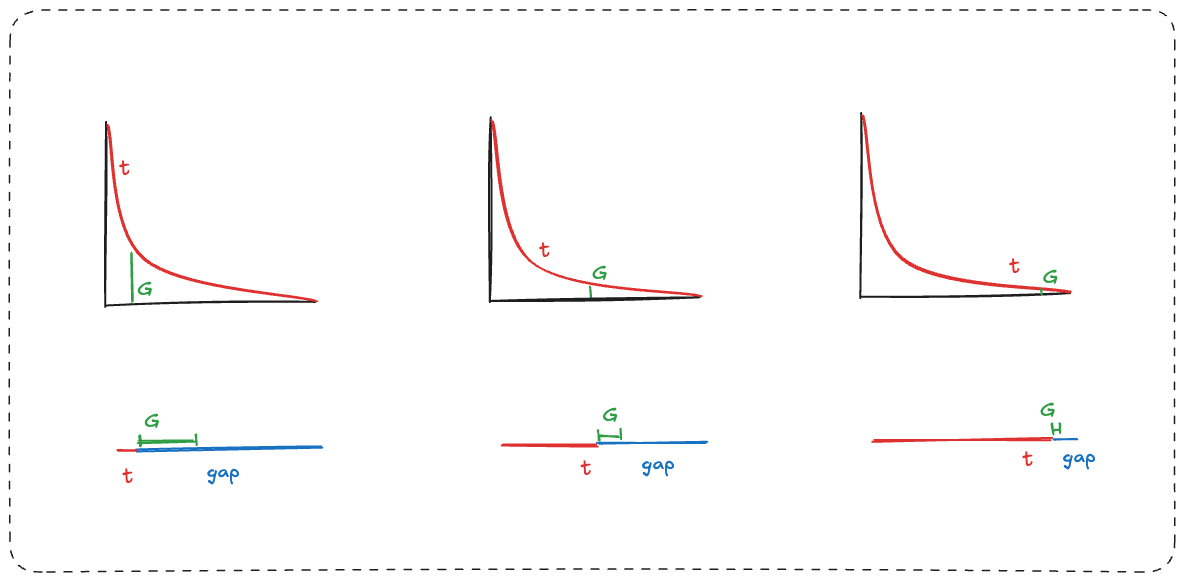
The decay represents the step change getting infinity smaller, because the remaining gap is also getting infinitely smaller.
Only the fraction taken from the remaining gap stays constant.
Logarithmic Effort
If we solve the decay equation for t, we can now view the effort it takes as we get closer to 100%.

This is the same problem as Zenos Paradox. The number of steps it takes goes up to infinity.
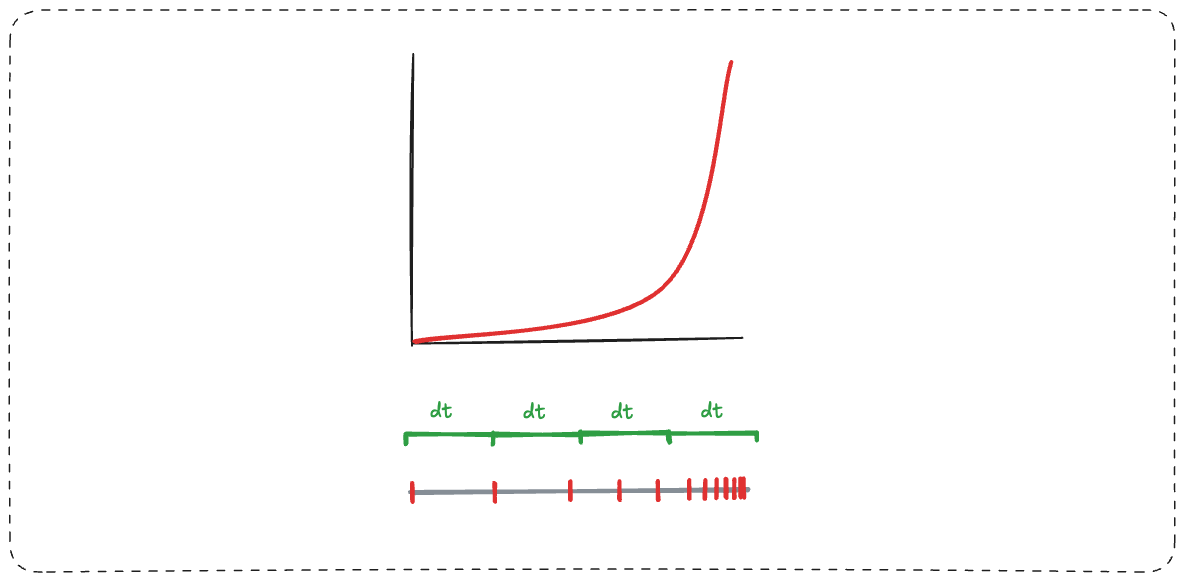 Each red tick represents the same amount of effort.
You just have more and more ticks for the same dt.
If you can only increase by 10% of the remaining gap, you will always still have 90% left to go, forever, no matter how close you get.
Summary
I know I’m not revealing any universal mysteries here by describing exponential growth as a feedback loop. We all already know that.
My goal with this post was to identify a potential cause of this in a potentially unexpected place.
And to notice that not all percentages should be viewed in the same way.
First try to understand if the system is chasing an ideal.
This will result in a self-reference.
Which means progress and effort will be in a feedback loop, and follow exponential decay and logarithmic growth respectively.
The graph ends up looking like this:
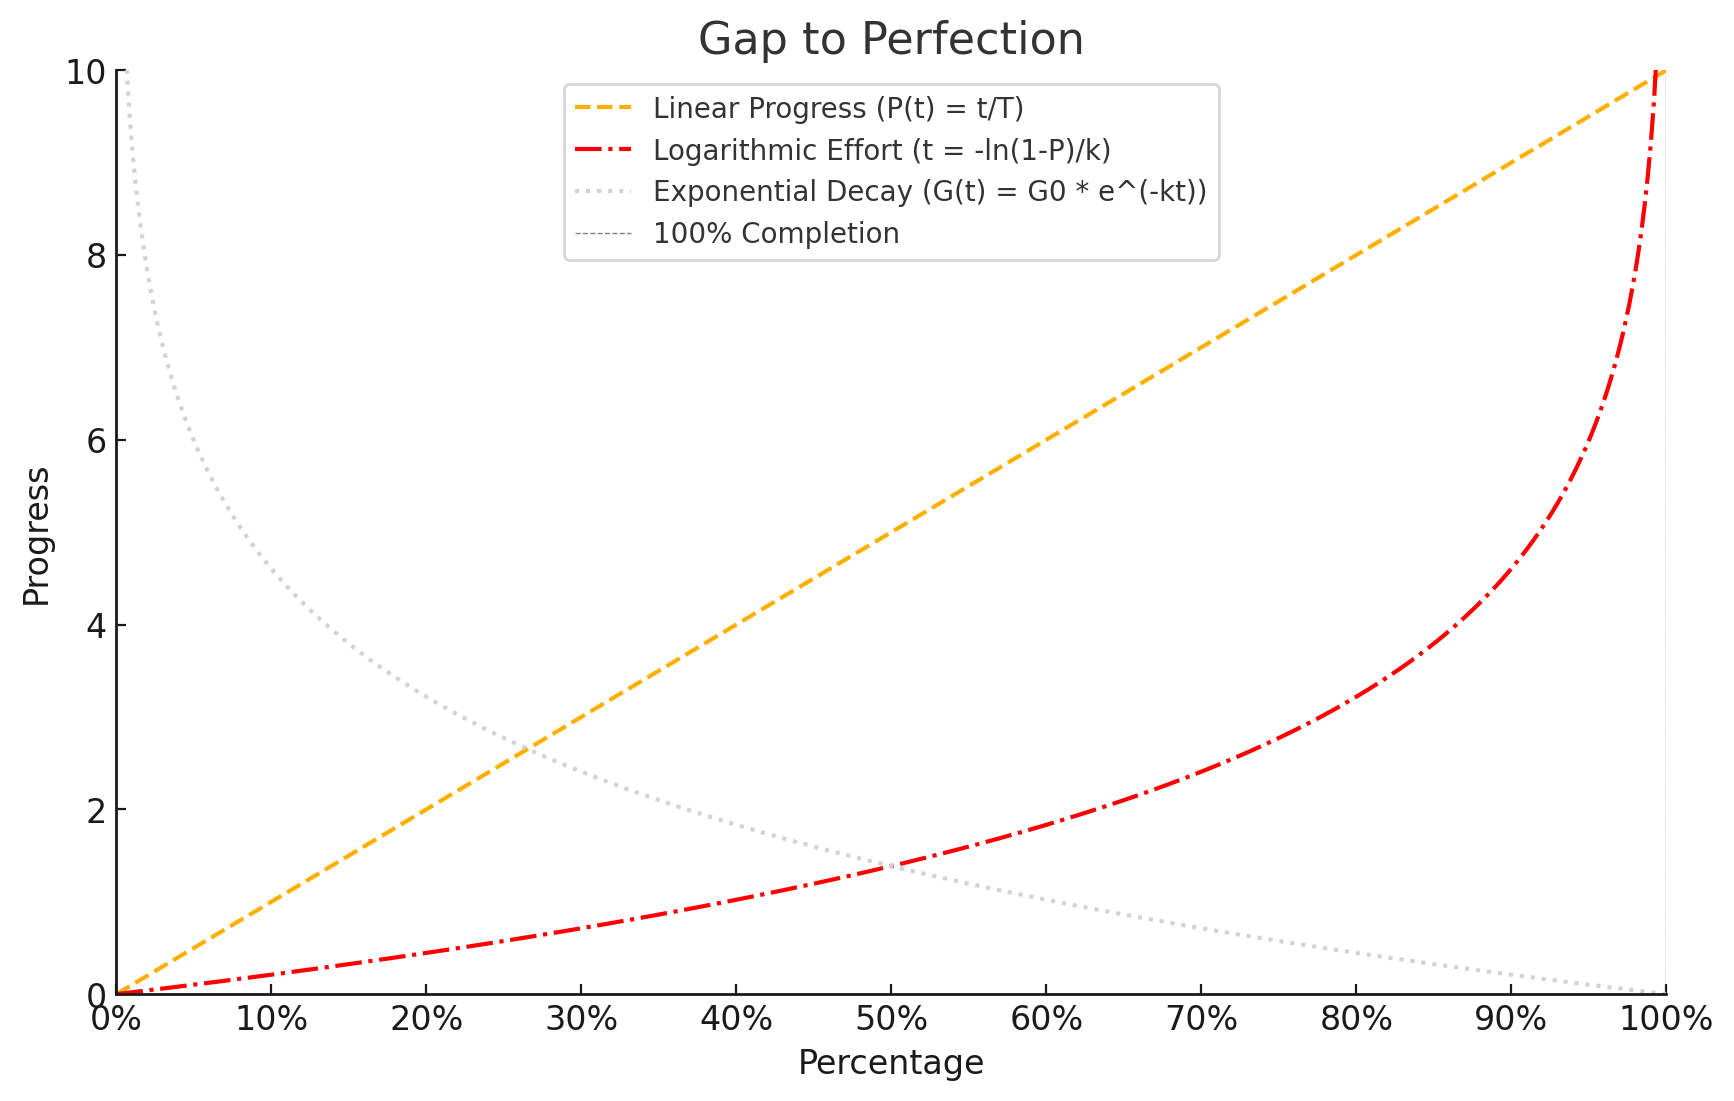
Should we look at the yellow line or the red one, when gauging how things are going?
Like everything else, it depends.
An important note about this perspective - we see that all the majority of the change happens in the last 90%. But it’s dependent on the previous 90% consistently happening.
This could mean a few things:
- Linear effort creates exponential growth
- We perceive things as slowing down, even if they are speeding up.
- Decay, growth, and consistency aren’t separate, but different only in perspective.
- Accelerated growth could represent a transition between states
If you are interested in how linear, exponential, and decay behaviors are interlinked - read about the Hyperbolic Perspective next.
I also notice a similar unintuitive tradeoff in spacetime velocity which is based on a circle.
You can read about that here: You Are Moving at the Speed of Light