I was doing some research today about a somewhat interesting relationship dealing with the question of how much difference in area there is between different laptop screen sizes.
This simple question lead to a wider insight on how we might choose to view change.
Is the difference between a 14 inch laptop and a 16 inch laptop really worth it?
14 doesn’t sound much smaller than 16. It’s only 2 inches or a 14% difference.
However the difference in screen area is 30%.
I thought it may be fun to analyze this simple relationship to see if there may be anything more interesting going on.
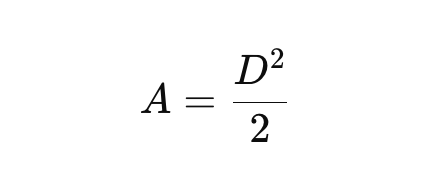
The formula for area by the diagonal is quite simple:
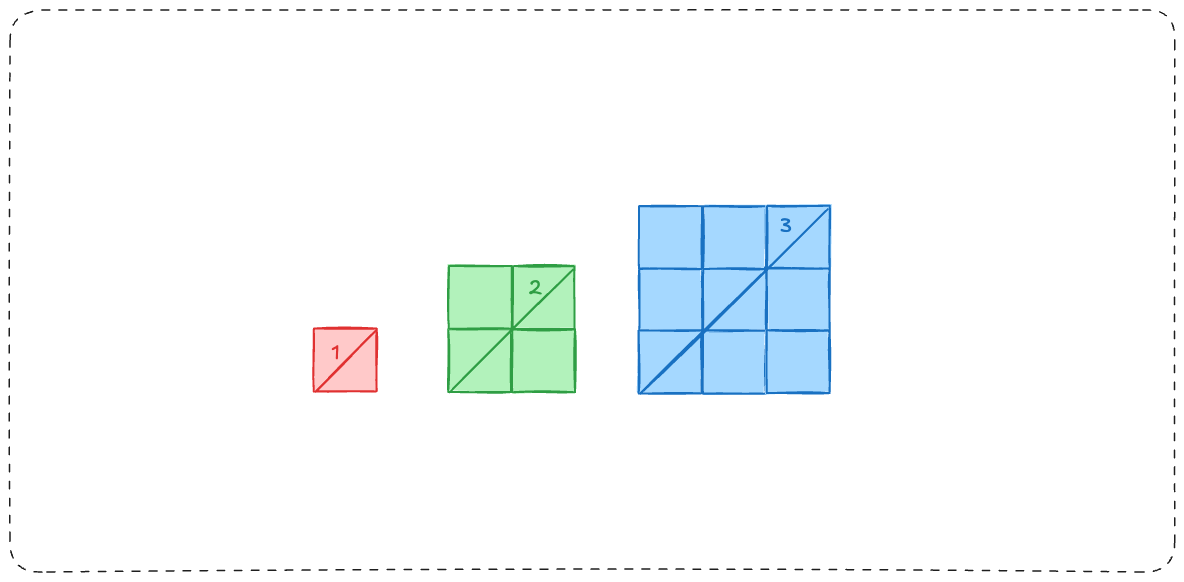
With length 1, you create 1 square.
2 creates 4.
And with 3, you create 9 squares.
This formula works for any rectangle, not just squares.
So it works for our laptop screens.
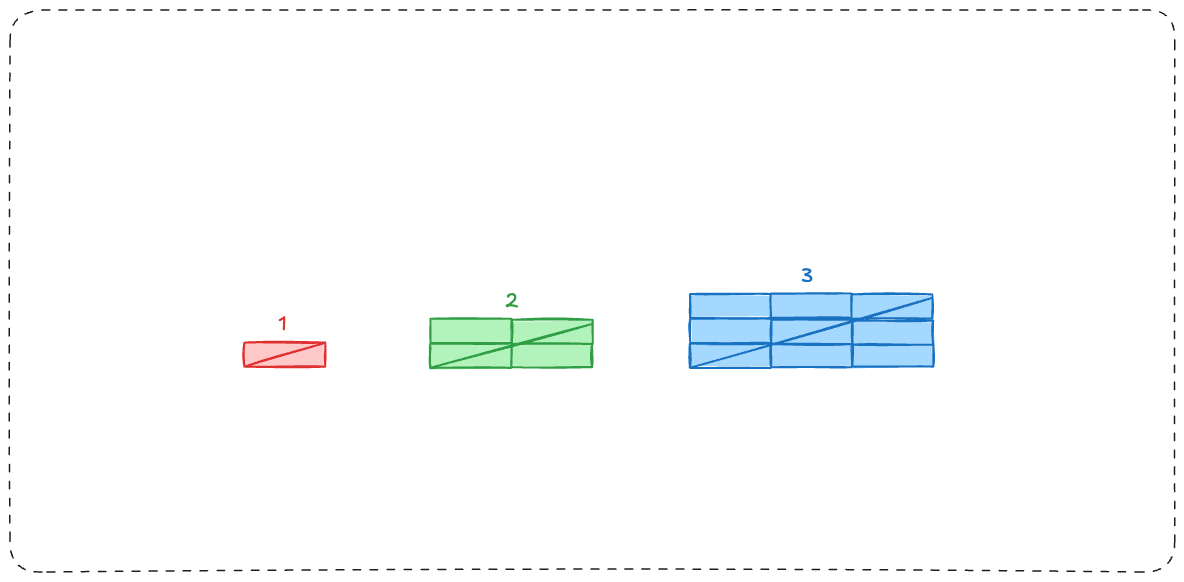
This means with the same linear increase, area increases by a larger amount each time.
This is simply a quadratic function, which generates a parabola when graphed.
When it went from 1 to 2, 3 squares were added.
From 2 to 3 added 5 squares.
The Changing Change
I was instead wondering what the relationship was between each increment and the previous one.
| Diagonal (inches) | Area (units) | Relative Increase (from 1-inch) | Relative Increase (from previous) |
|---|---|---|---|
| 1 | 0.923 | 1 | ~ |
| 2 | 3.692 | 4 | 4.0 |
| 3 | 8.308 | 9 | 2.25 |
| 4 | 14.769 | 16 | 1.778 |
| 5 | 23.077 | 25 | 1.5625 |
| 6 | 33.231 | 36 | 1.44 |
| 7 | 45.231 | 49 | 1.361 |
| 8 | 59.077 | 64 | 1.3061 |
| 9 | 74.769 | 81 | 1.265625 |
| 10 | 92.308 | 100 | 1.2345 |
To do this, just divide the current area by the previous one before squaring:

Generating the graph:
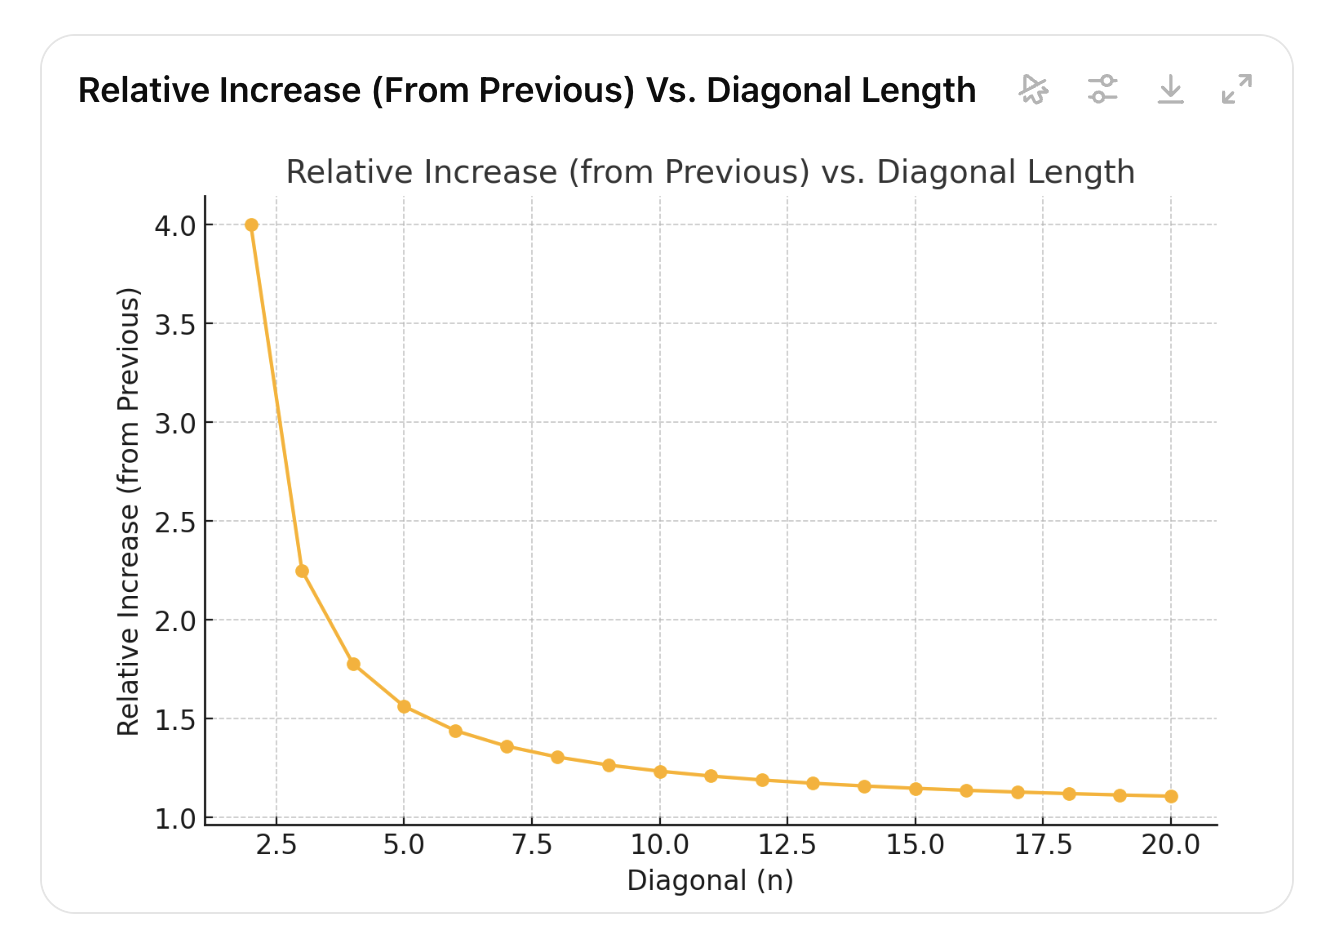
We can see that with each diagonal increase, the difference between it and the previous increase is actually going down (and approaching 1).
When we went for length 1 to 2, the area was multiplied by 4.
When we went from 2 to 3, the area multiplied by less: 2.25.
The reason I find this interesting is it shows an example of how your perspective can be misleading.
The relative increase graphed above shows a function of diminishing returns, while the actual behavior of the relationship is one of quadratic growth.
With every linear increase you are getting increasingly more screen area, how ever it feels like you are getting less because the ratio from the last increase is decreasing.
Think about increasing a 1 inch screen by 1 additional inch. The difference in screen size is massive! But add 1 inch to a 100 inch screen, and you can barely tell the difference. Even though the real amount of screen area added to the 100 inch screen was many, many times more than the amount added to the 1 inch screen.
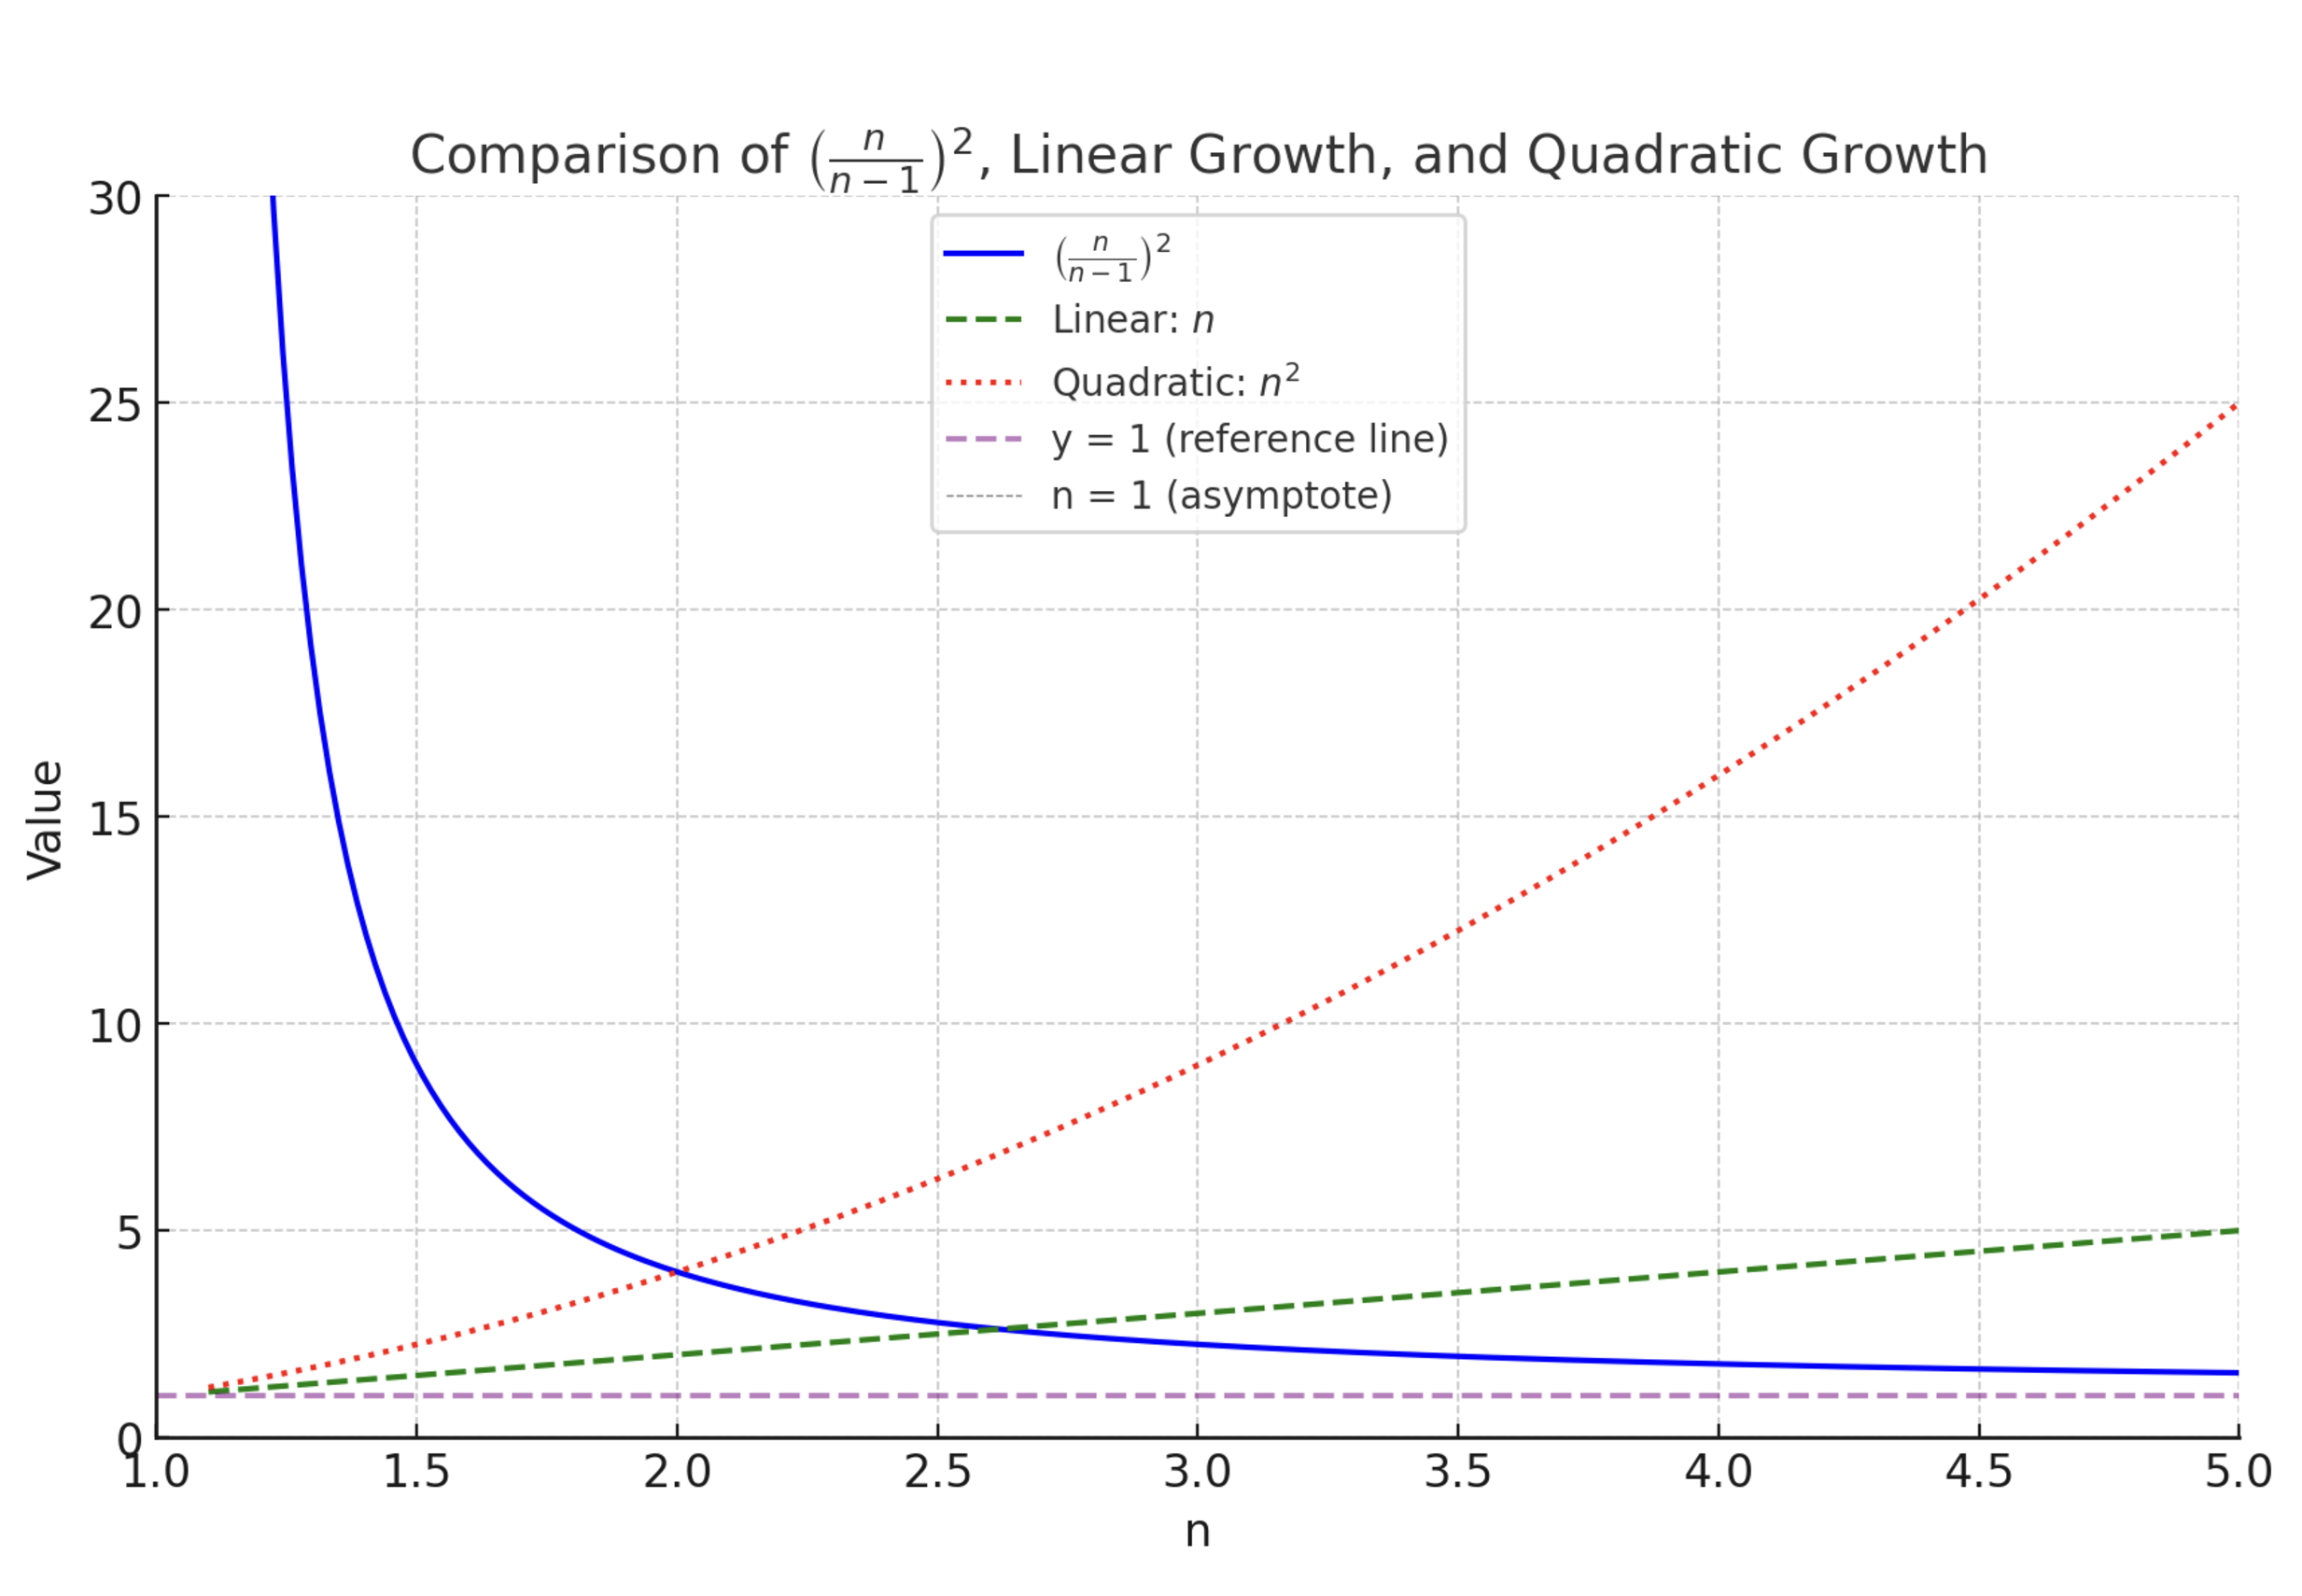
The green line is the diagonal length of the screen. You can see the increase in area with the red line, and our perception of the relative increase in blue.
On larger scales, the red line goes vertical (approaches ∞), while the blue goes horizontal (approaches 1). Meaning infinite increases perceptually feel like no change at all.
As n → ∞, the limit of each step will increase the area by ∞. It is the same as the ∞ of the last increase, so the ratio of ∞/∞ is 1
Hyperbolic Extrapolation
I find this relationship interesting, as we can wonder about broader implications in the real world where this may be happening.
Are we simply viewing things with the wrong perspective? Why can we feel stuck when we are always doing more and more?
I’d like to refer to this perspective as the hyperbolic perspective.
Instead of looking at objective changes, we tend to look at relative ones.
This leads to a misleading perception of diminishing returns, even as real change is actually accelerating, because you are comparing the ratio instead of the amount.
Diminishing Returns
A hyperbola reflects a situation where initial changes have significant impact, but additional changes produce progressively smaller effects.
Let’s see how the diminishing return sequence is related to a hyperbolic function
Hyperbolas
To create a hyperbola, first place 2 points. Then consider a point, and subtract its distance to the further point from the distance to the nearer point. this difference can be called α.
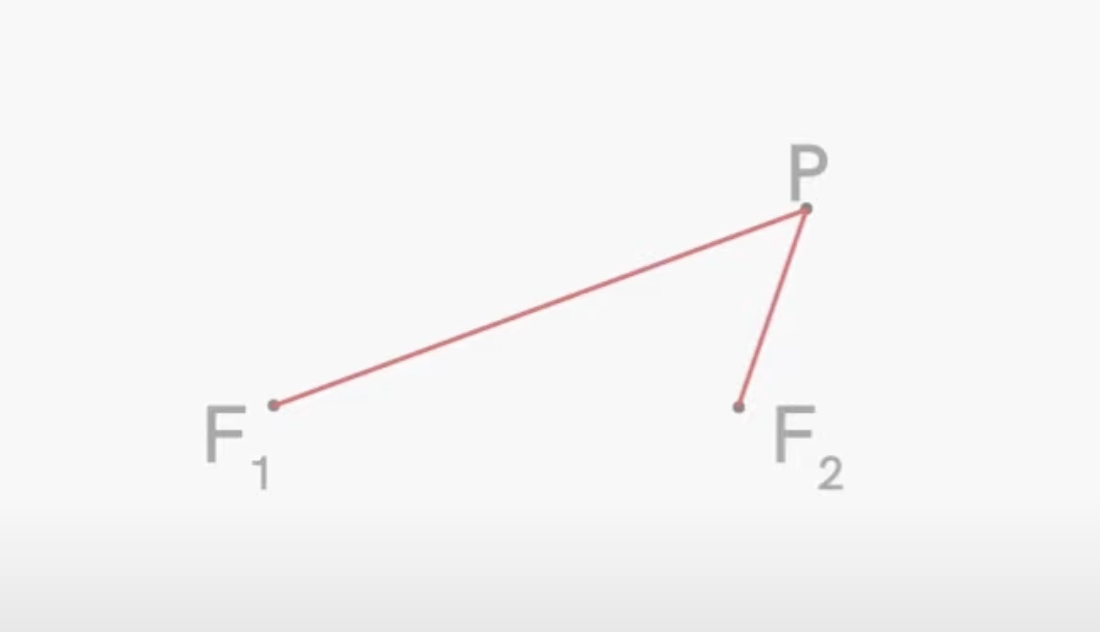
PF1 - PF2 = α
Now consider if there are any more points where α would have the same value.
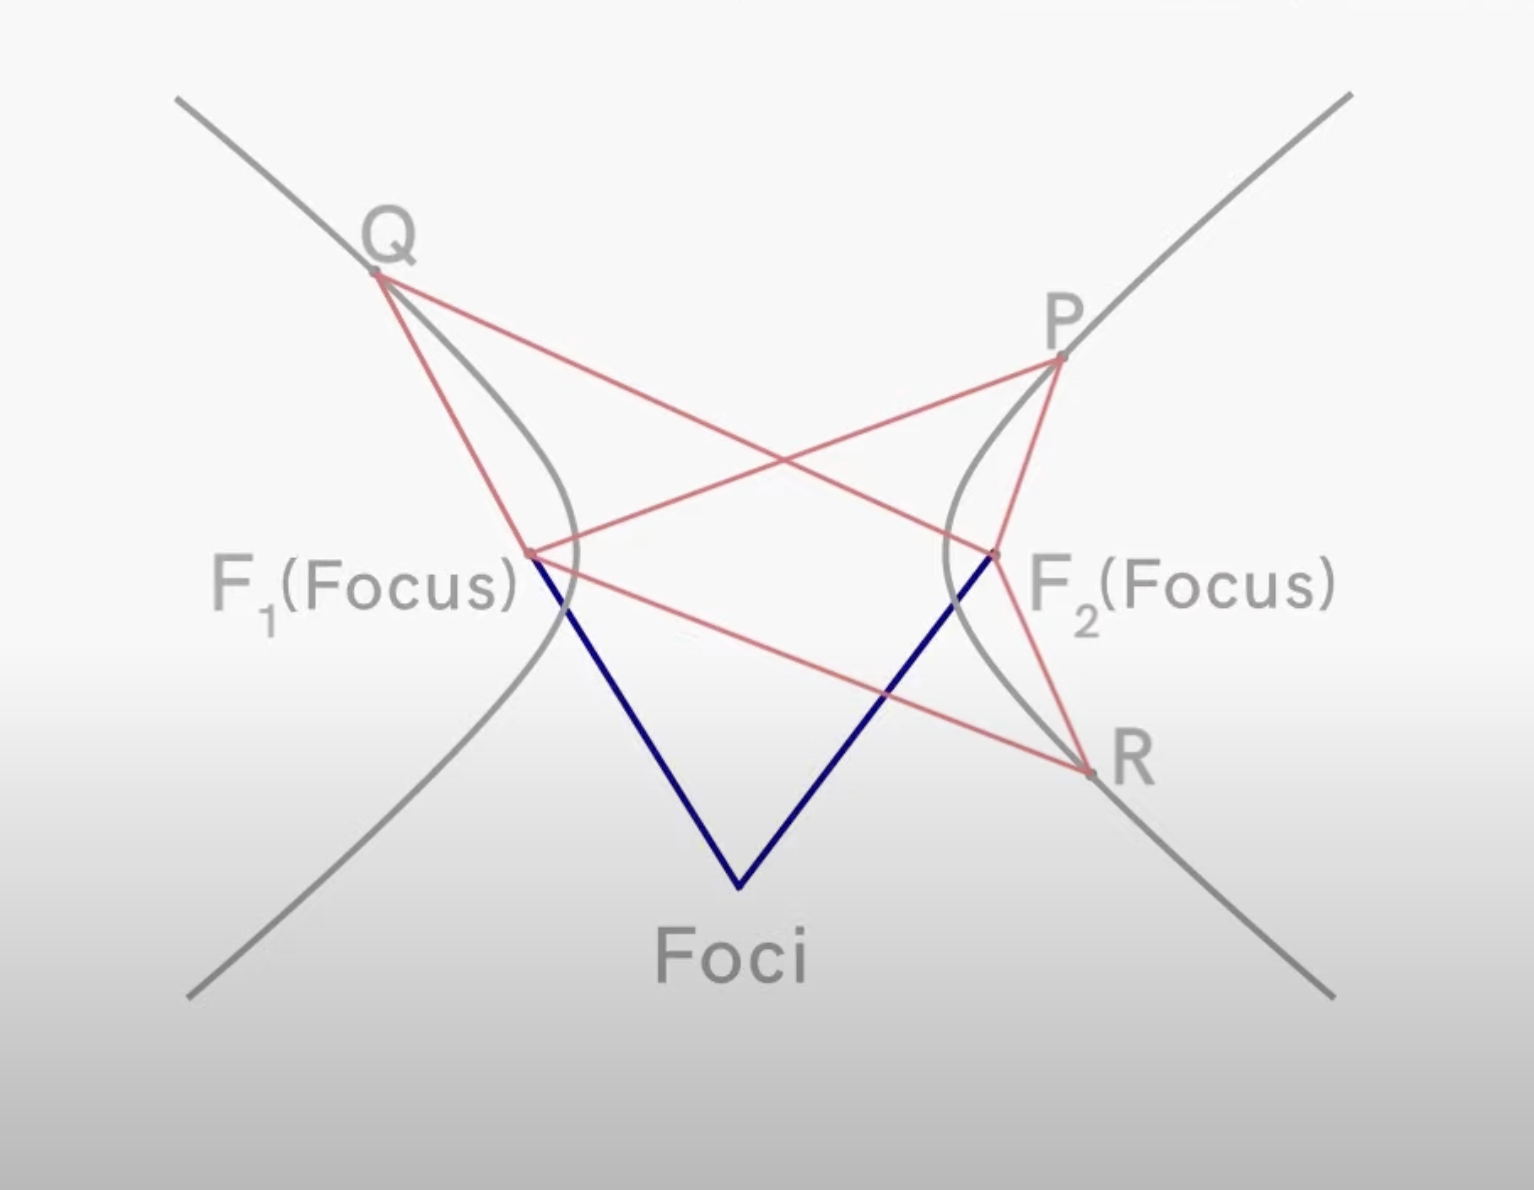
PF1 - PF2 = α
RF1 - RF2 = α
QF2 - QF1 = α
This is how to create a hyperbola.
The 2 points are known together as the foci.
The two curves are the hyperbola, when α is set to 1 is described by the following formula:
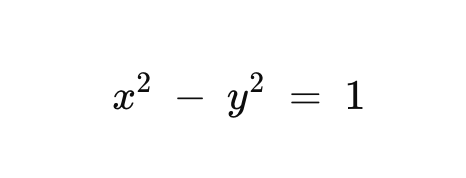
which states that the difference of the distances to the foci remains a constant.
This shape has the characteristic of changing rapidly at first, and then approaching a linear asymptote:
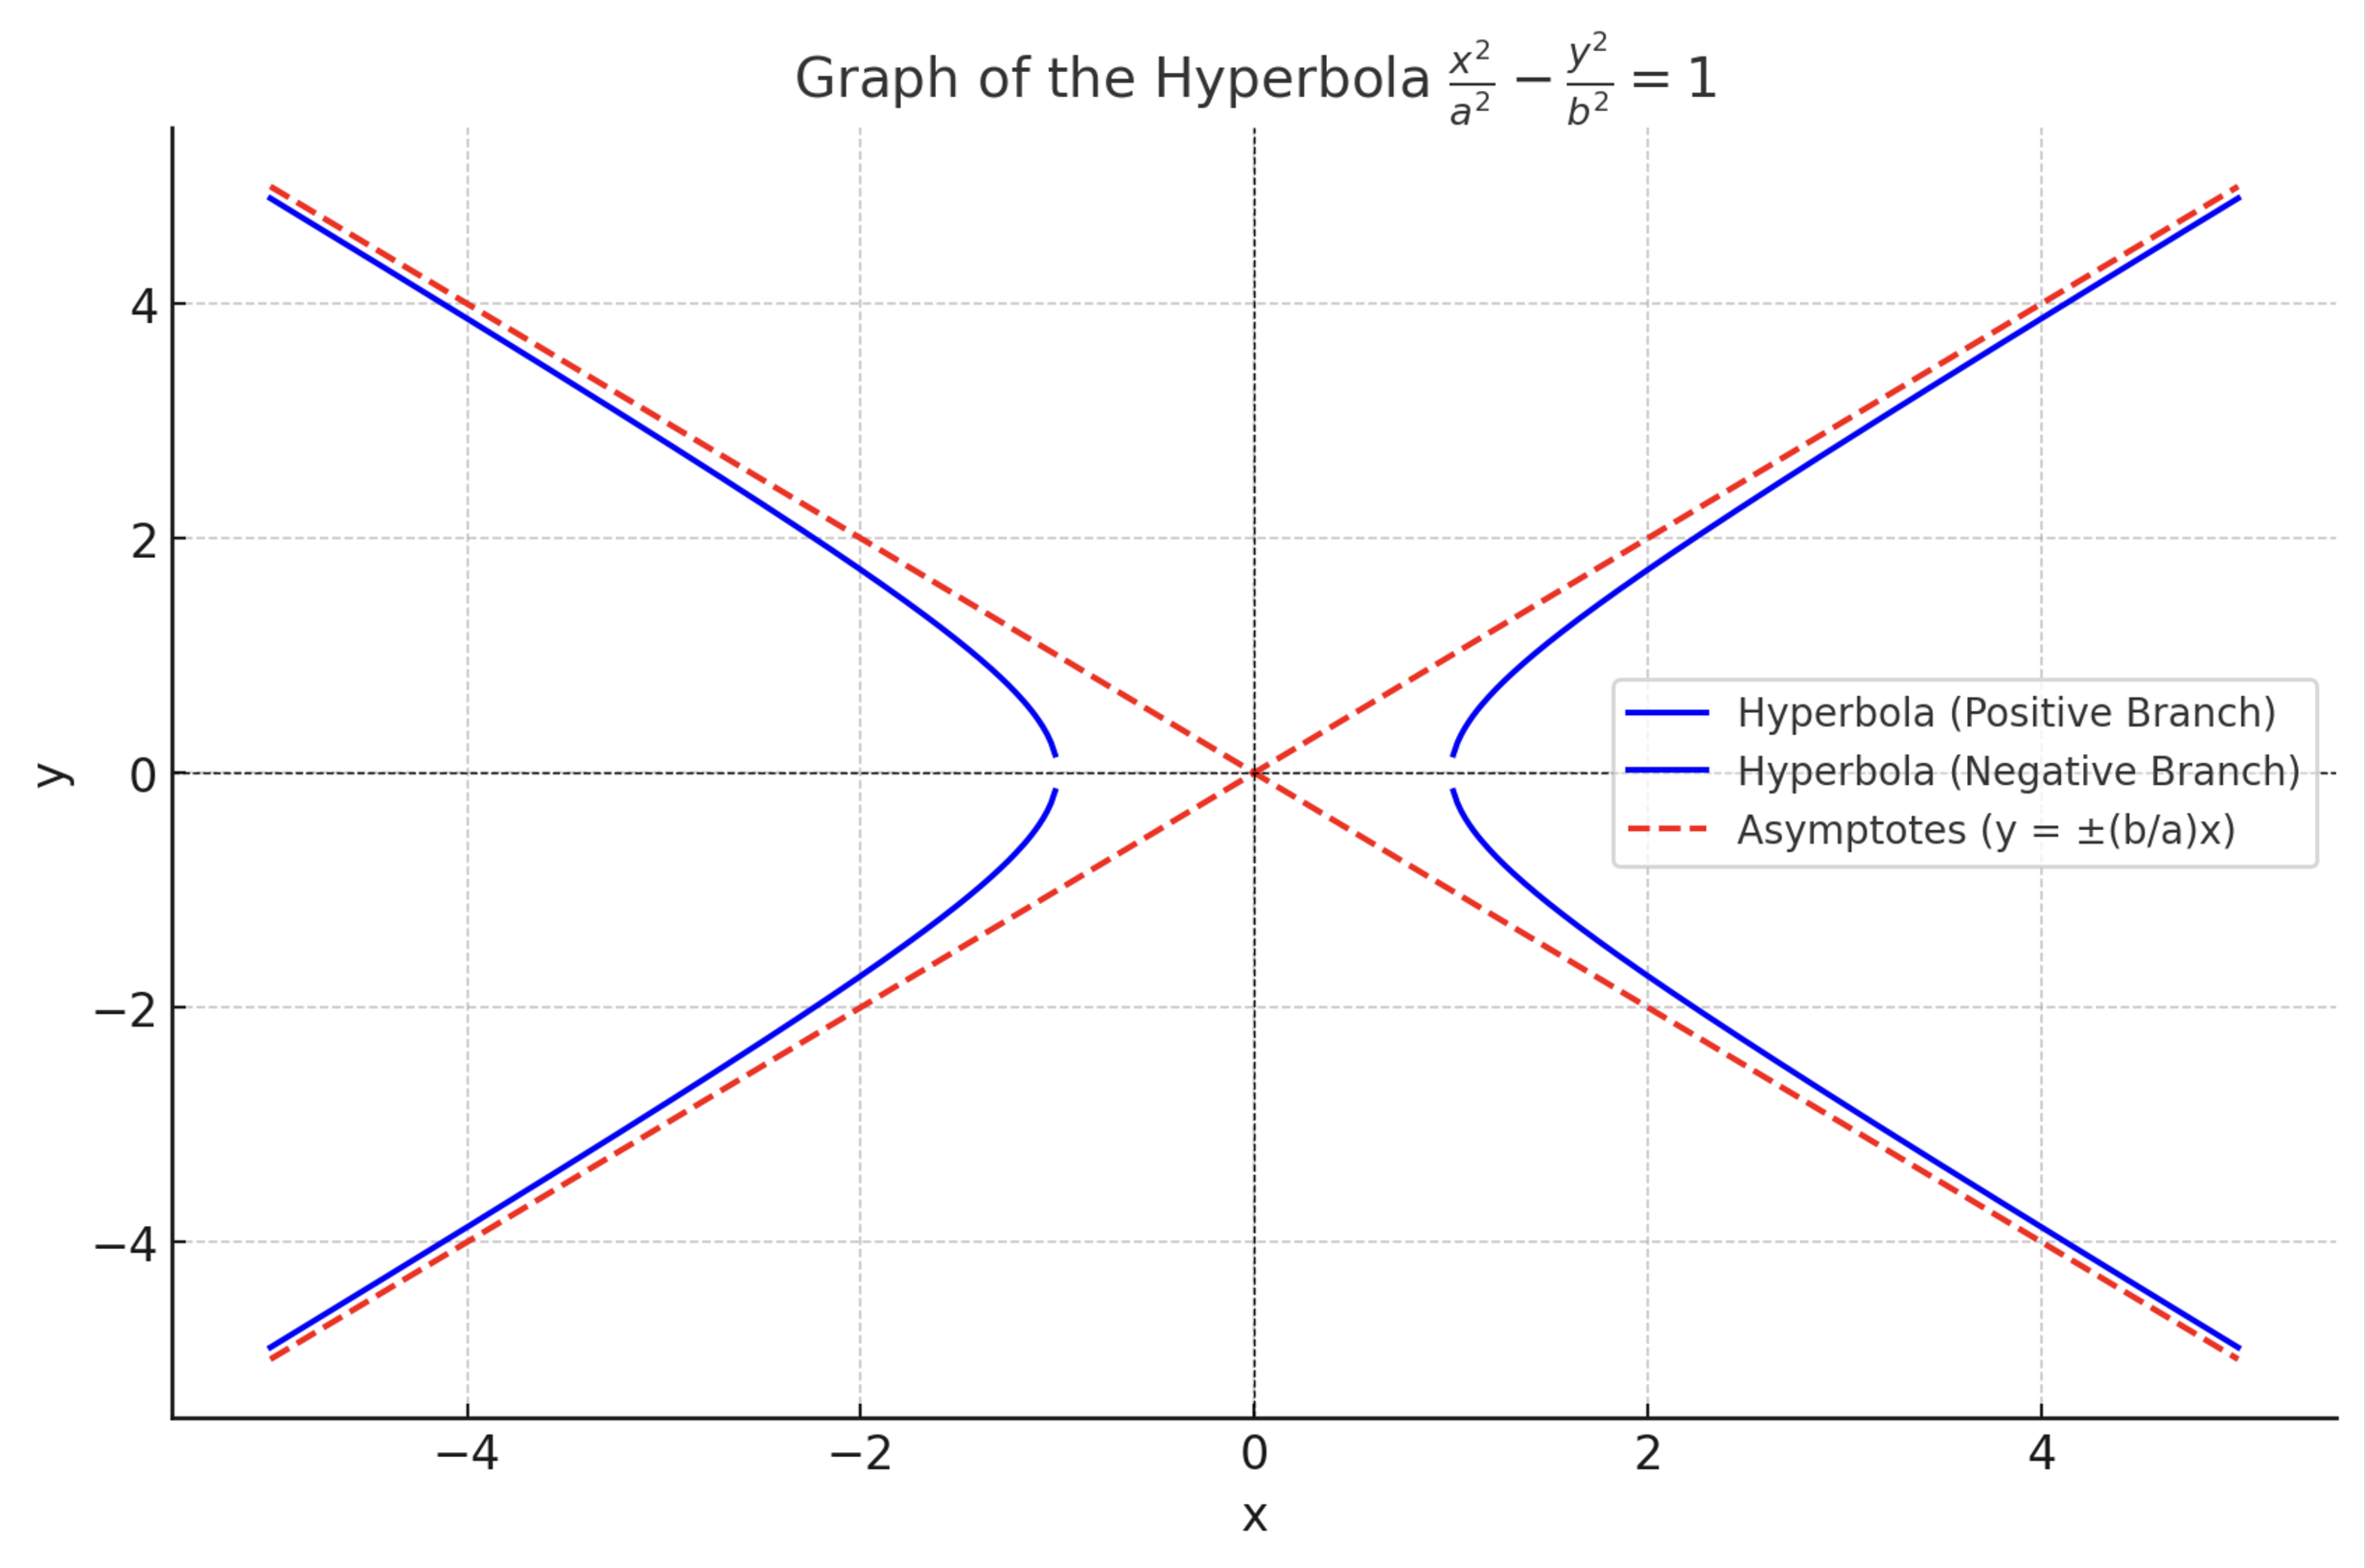
The greatest rate of change happens at the initial point, where it then approaches a constant linear rate of change.
Describing Rate of Change
Let’s now focus on only the positive quadrant by solving for y:
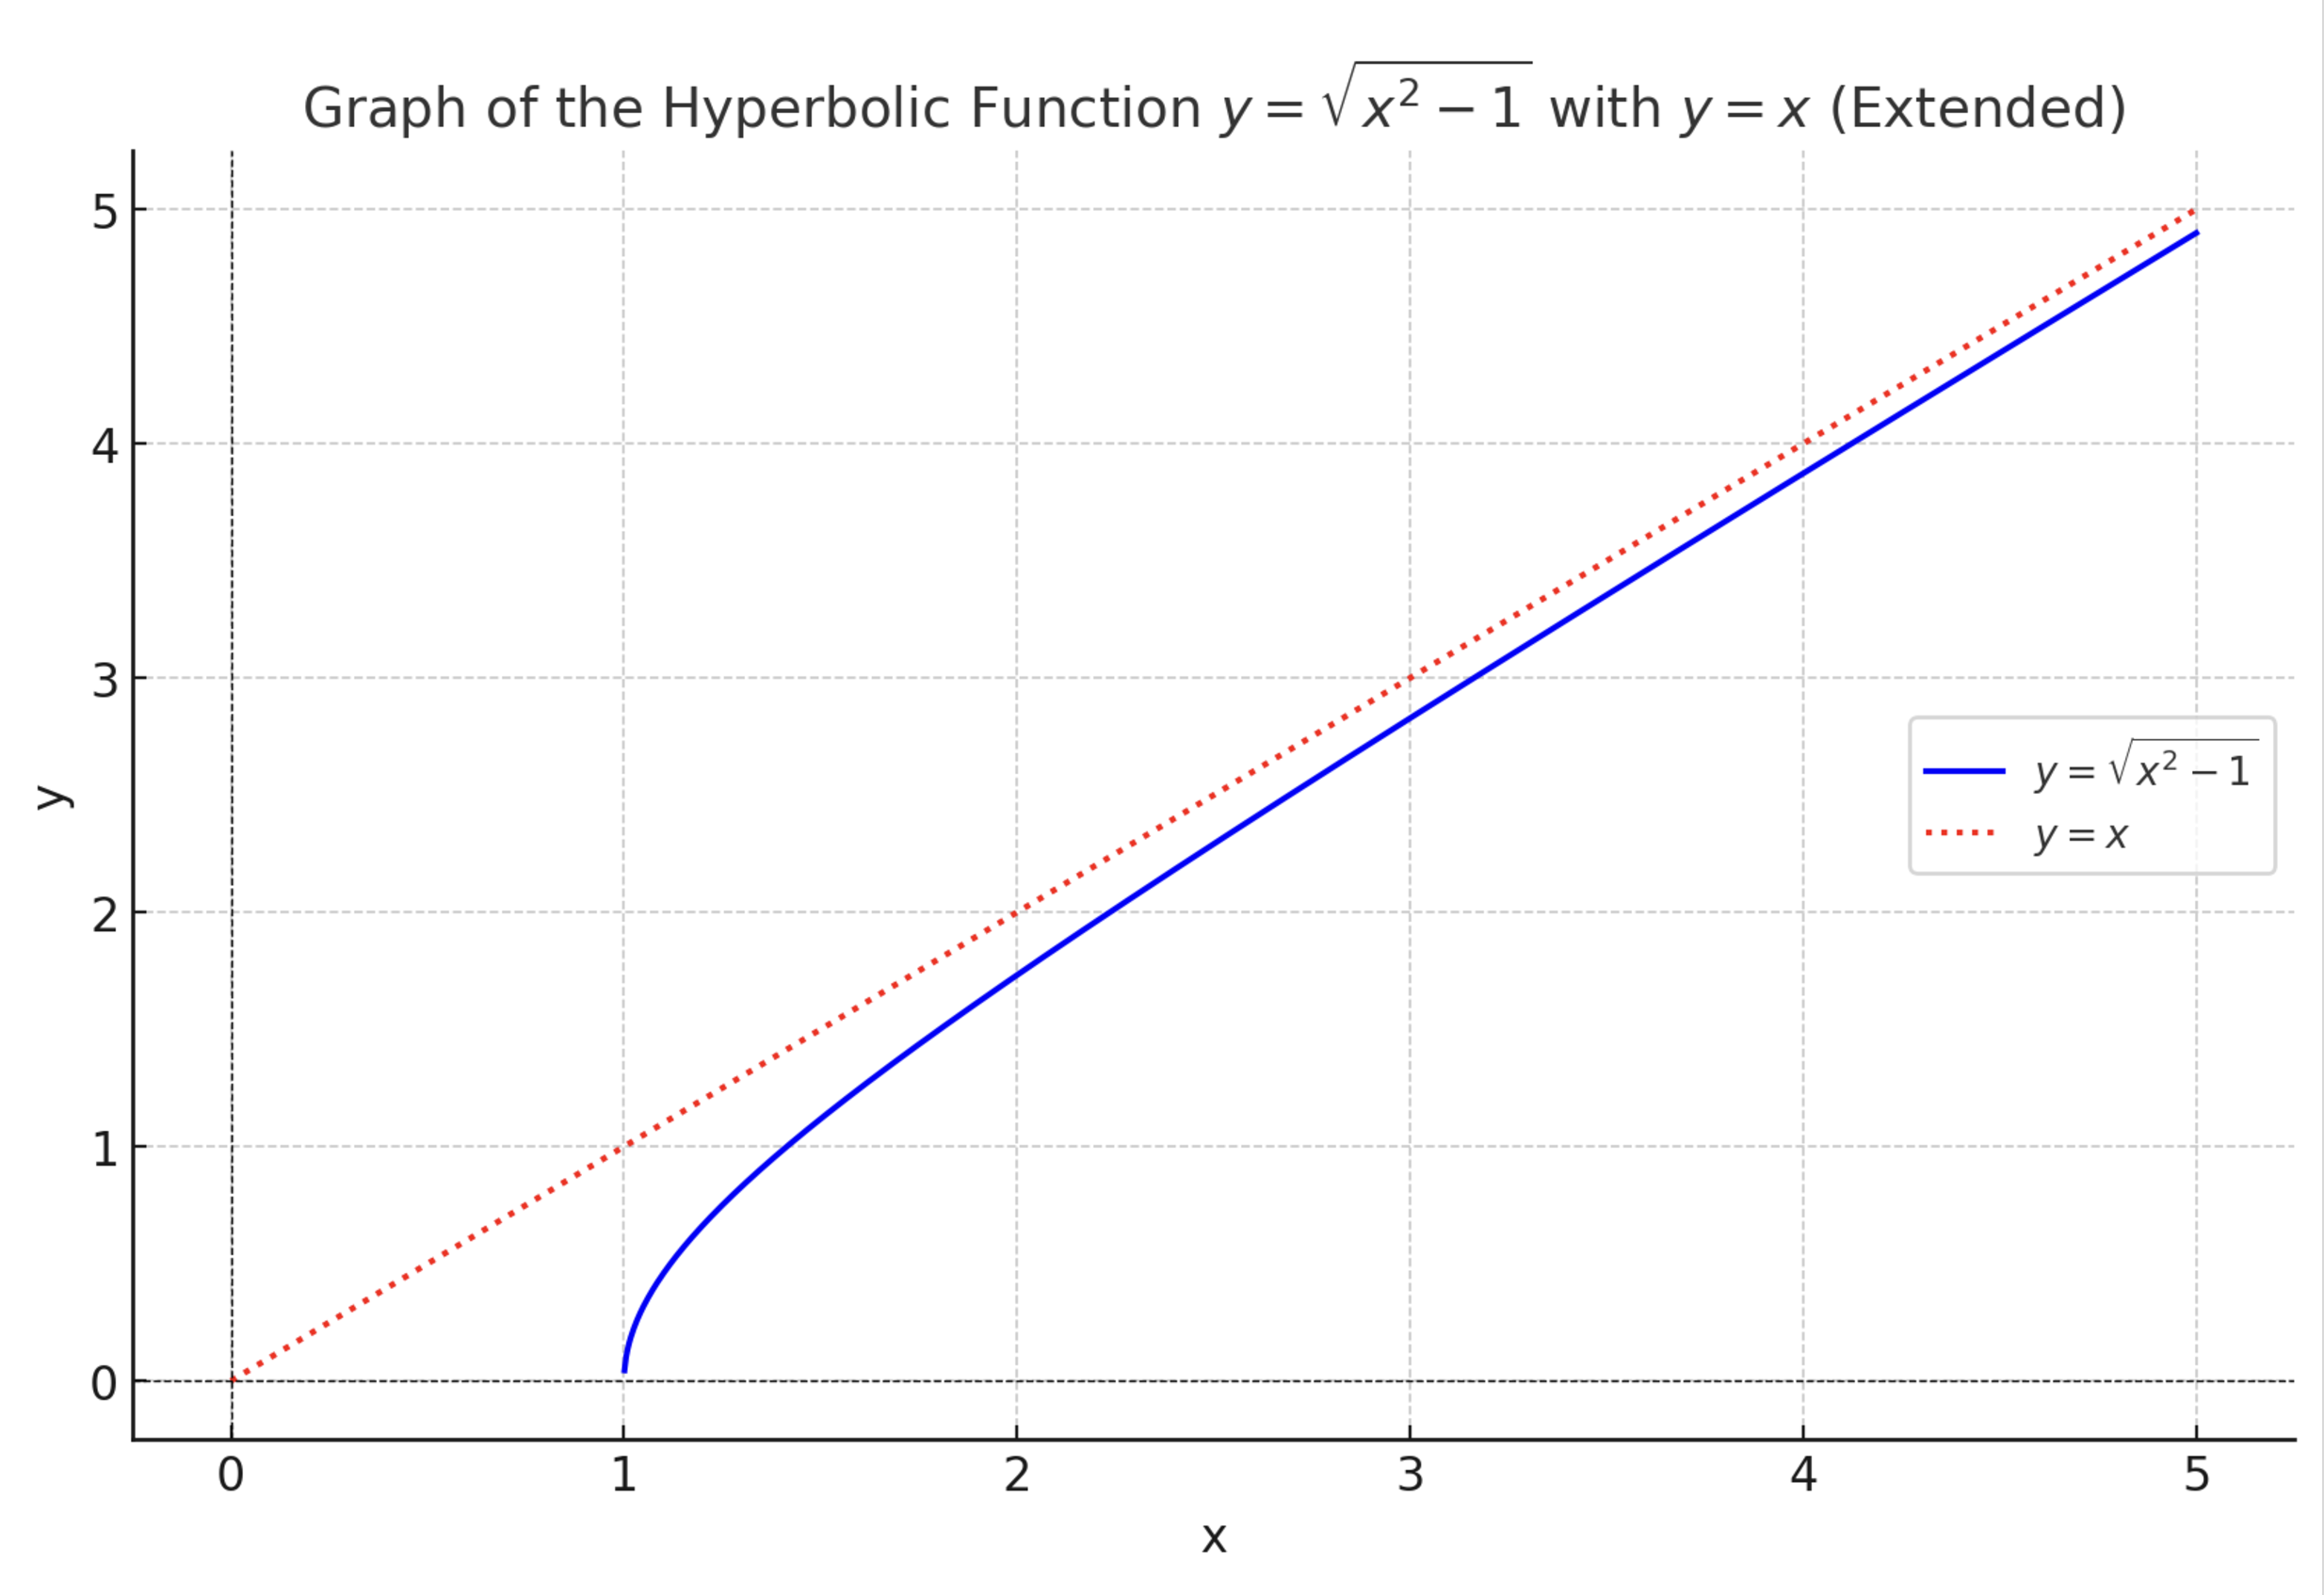
We see that that at first there is a steep slope, which then approaches a linear slope.
This acts like an integral of the diminishing return function we made earlier, as the change of the function correlates with the slope of the hyperbolic function.
To show this, lets take the derivative of the hyperbolic and plot it:

Notice that the derivative has exactly the same behavior as our diminishing returns function we derived above.
Interestingly enough, if we take the integral of the hyperbolic function and it shows quadratic growth.
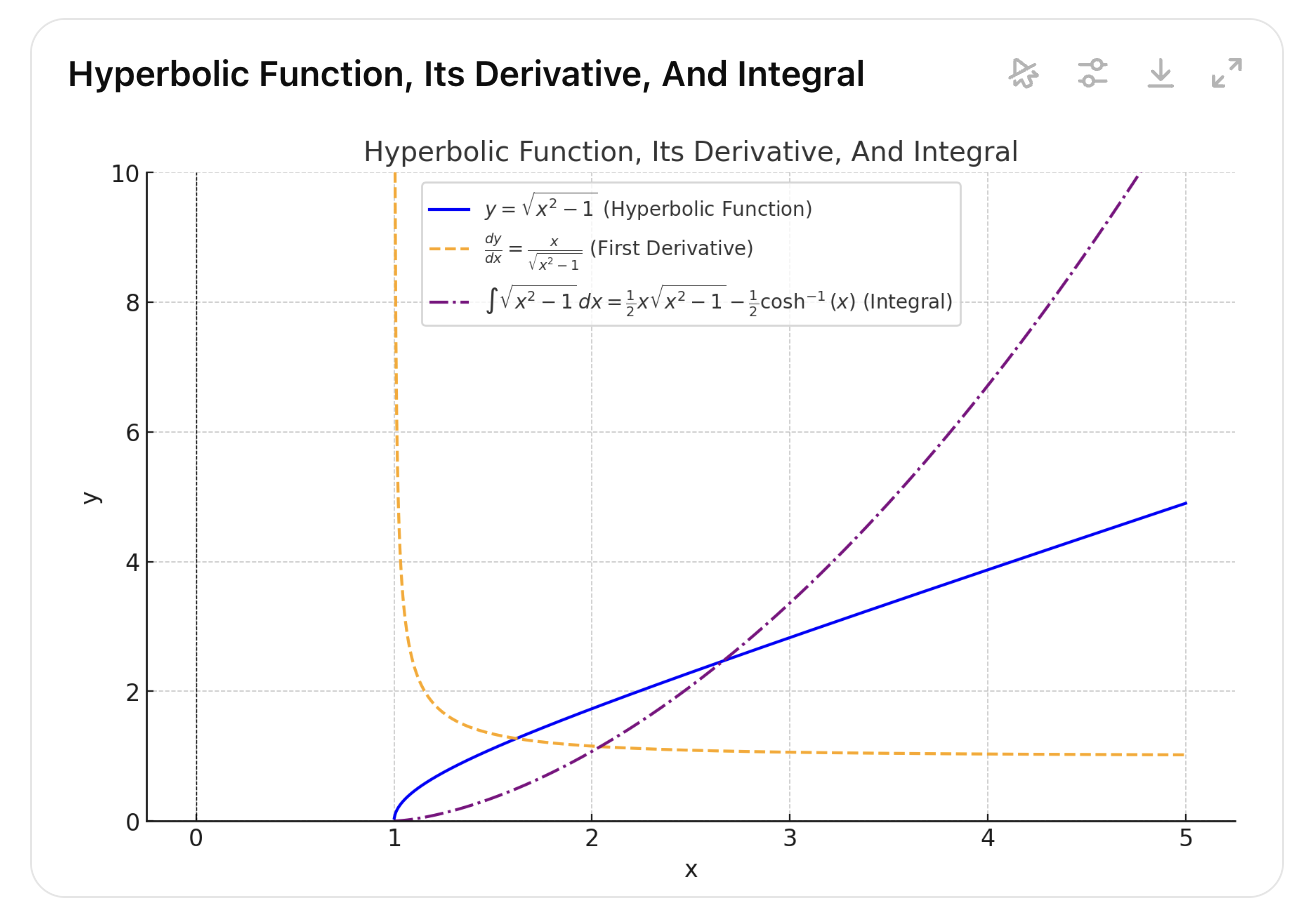
So we now have our connection:
- growth (integral)
- hyperbolic
- decay (derivative)
“Wait, it’s all calculus?”
🌍👨🚀🔫 👨🚀
“Always has been”
Note on Exponentials
I don’t want to dive into exponentials right now, but just like how quadratic functions represent accelerated growth, so do exponentials.
There are similar hyperbolic relationships there. They balance the differences between growth and decay. I can try explaining them in another post - maybe.
Summary
All of this is to illustrate a dichotomy.
Many already know the connection between hyperbolic functions and diminishing returns.
It’s interesting to see that it also connects to accelerated growth. A force that dominates our economy, our world, and the universe. It seems to be a consequence of calculus, of the necessity to have limits on infinities for any discrete things to exist at all. You will always have a transition, or a concentration, near the limit.
The difference between accelerated growth and diminishing returns is how you view it. As it’s integral, or it’s derivative. Do you see the accumulation, or do you experience the momentary changes.
This hyperbolic perspective is experienced all over the place in our lives. It has many applications: the 80-20 rule, The Power Law, Market Volatility, and Gravitational Mass Concentration to name a few.
All of these phenomena may bear the same existential basis as choosing the right laptop screen size.